|
Research |
--- |
|
|
|
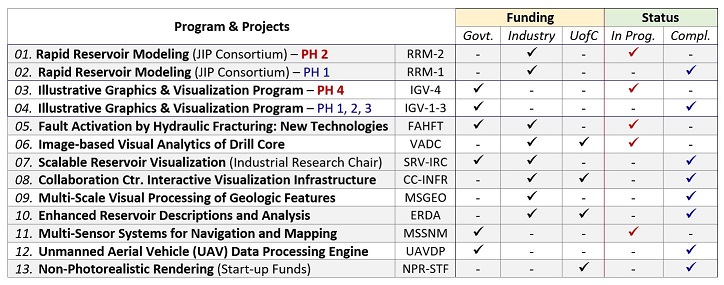
Hyperlinked Table (Projects In Progress, i.e, no. 01, 03, 05, 06, 11);
|
|
|
01. |
---- Joint
industry project (JIP), PHASE 2.
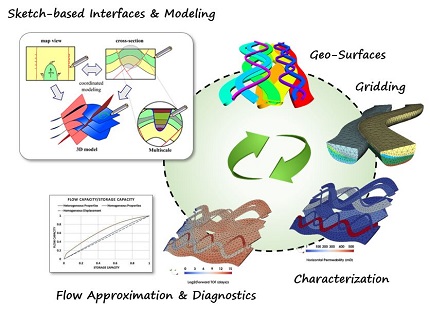
A multi-disciplinary (i.e.,
Computer Science, Geoscience, and
Petroleum Engineering) research
and development of a Rapid
Reservoir Modeling (RRM) software
framework for prototyping complex
conceptual reservoir models,
using novel, sketch-based
interface and modeling (SBIM)
algorithms and methods,
exploratory visualization &
visual analytics, and numerical
modeling and analysis of
fundamental reservoir properties
and behaviors.
1. Dr.
Mario Costa Sousa
(Co-PI) University
of Calgary, Computer
Science (CAN) 2. Dr.
Sebastian Geiger
(Co-PI) Delft
University of
Technology, Geoscience
& Engineering
(NLD) 3. Dr.
Matthew Jackson
(Co-PI) Imperial
College London, Earth
Science &
Engineering
(GBR) |
||||||||||||||||||||||||||
|
|
|
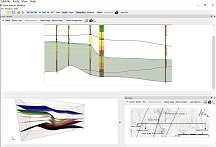
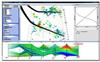
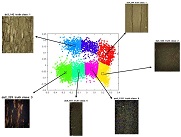
(1)
To create informative, illustrative
visualizations from modern STM data
experiments, simulations and acquisitions,
which are robust in their expressiveness
and communication while providing room for
visually exploring the data and gaining
new insights into their uncertainties.
(2)
To ensure the context is captured by the
illustrative techniques used when
information is presented during a
visualization task, consisting of
characteristics with varying degrees of
available information (e.g., data
modality, size, detail, and uncertainty),
the interactive modeling, rendering and
visualization communication goals, the
users' expertise and experience, and the
interaction techniques and technologies
being utilized. Also,
refer to PHASES
1, 2, 3. |
|||||||||||||||||||||||||
|
|
|
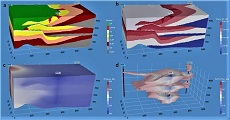
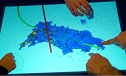
(1)
Understanding which pre-existing
faults are prone to induced
seismicity; This
project's objectives include identifying
and mapping critically stressed faults and
understanding their impact on hydrocarbon
production. Technological advancements
within this program, including visual
computing and machine learning, will
contribute to the responsible development
of natural resources, improved fundamental
understanding of earthquake activation
mechanisms, and unique opportunities to
generate innovative methods and
workflows. https://www.microseismic-research.ca/ |
|||||||||||||||||||||||||
|
|
|
|
|||||||||||||||||||||||||
|
|
 |
|
|||||||||||||||||||||||||